By Seton Stiebert
Introduction
Canada’s greenhouse gas inventory is typically published by Environment and Climate Change Canada in April of a given year (ECCC 2023), when reporting lags the publication date by 16 months, so that in April 2023, emissions are available for the calendar year ending December 2021. In other words, just before the April 2024 National Inventory Report (NIR) is published, comprehensive greenhouse gas emissions data for Canada will be 28 months old.
The delay is understandable given that ECCC must gather a very large amount of input data from disparate sources and then conduct a comprehensive analysis following strict methodologies, quality assurance, and FPT review processes. At the same time ECCC also provides annual emissions trend projections out to 2030 that account for existing and planned policies.
Projections are based on ECCC’s Energy, Emissions and Economy Model for Canada and published for the purpose of representing progress to Canada’s 2030 climate target and to demonstrate the impact of Canada’s climate policies (ECCC 2023).
In contrast, the focus of 440 Megatonnes’s Early Estimate of National Emissions (EENE) is to generate a short-term outlook rather than estimating long-term policy impacts. In this case, the estimate is not forward looking—it uses gathered activity data for 2022 (i.e., industry production in physical units, gross domestic product [GDP], or demographic changes between 2021 and 2022) to understand how emissions may evolve in combination with historical trends in different decarbonization drivers (e.g., energy efficiency, fuel switching, and other measures that reduce greenhouse gas intensity per unit of production).
The value of an unofficial and preliminary estimate of emissions is that it gives an early signal for policy makers and stakeholders as to whether changes in activity and existing trends that reduce emissions are on-track towards longer-term targets. The EENE can improve decision making by accelerating how emissions data is reported and acted on. Early estimates can also be helpful in unveiling how disruptions to the economy or production in Canada (e.g., a global pandemic) contribute to emissions changes. The recent COVID-19 pandemic is an example of a short-term disruption where GDP fell by almost five per cent and activity in specific sectors such as passenger transportation fell by more than 10 per cent.
Much of the production, demand, and demographic activity data that drives emissions and is published by Statistics Canada and other bodies, typically lags by much shorter time periods of only a few months. It is possible to gather and analyze this data to estimate recent short-term changes in emissions intensity for different categories of emissions that can in turn be used to close the publication gap to within a period as short as eight months. While these emissions projections are not the same as the rigorous bottom-up estimates of the NIR, they do account for activity related to the sector which has been demonstrated to be the predominant emissions driver for most emissions categories.
The methodology and data used to develop national early estimates of greenhouse gas emissions for both the economic sector and the Intergovernmental Panel on Climate Change emissions categories is summarized below.
Methodology to Develop 2022 Greenhouse Gas Estimates
Early greenhouse gas estimates for each emission category in the NIR are generated using economic or activity data that is published with a lag of less than eight months, as well as a consideration of historic trends in energy efficiency and decarbonization. Emission estimates are prepared following ECCC NIR mapping for both economic sectors and Intergovernmental Panel on Climate Change (IPCC) sectors.
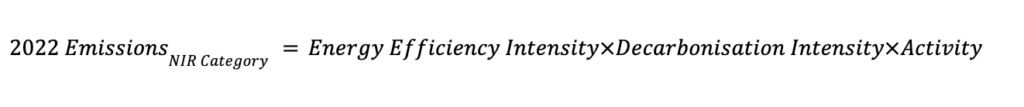
Emissions from 2021 for each emission category are solved by multiplying the terms of projected energy efficiency intensity and decarbonization intensity with the published activity data collected:
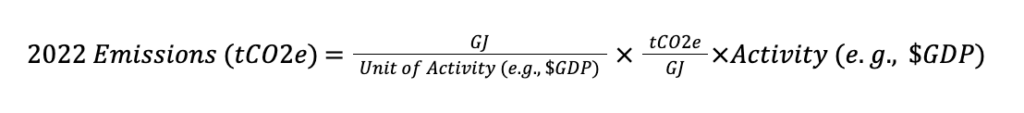
For non-energy related emissions the energy efficiency term is dropped and the decarbonization intensity is simply expressed per unit of activity.
Developing the terms for energy efficiency intensity and decarbonization intensity requires a 2022 projection of these terms that are based on historical relationships over time since the year 2005. For energy emissions that account for approximately 80 per cent of the total emissions inventory we consider:
- Annual rate of energy decarbonization or the change in greenhouse gas emissions per unit of energy between 2005 and 2021.
- Annual rate of energy efficiency or the change in energy per unit of activity between 2005 and 2021.
For non-energy related emissions that account for approximately 20 per cent of our total emissions inventory (industrial process, agriculture, and waste emissions) we consider:
- Annual rate of decarbonization or the change in greenhouse gas emissions per unit of activity between 2005 and 2021.
A weighted average historical change in energy efficiency and decarbonization is used to estimate a value for 2021. While the weighting considers the historical trends in energy efficiency and decarbonization since 2005, it weighs most recent years more heavily (i.e., changes in annual intensity for the years between 2015 and 2021, are weighed more heavily than the annual changes in intensity for the years between 2005 and 2015). In addition, where the 2021 year exhibits a change in activity far outside the historical average (due to the COVID-19 pandemic) the weighted average of the 2019-2021 year is excluded. Finally, where the 2021-2022 change in activity increased by an amount significantly above the historical average, historical years that also had significantly higher than average activity increases were weighted higher. These weighting corrections were found to be necessary to account for non-linear responses in emissions changes that arise from large changes in activity.
Developing the terms for activity required gathering publicly available data for 2022 in a limited timeframe within eight months from the end of the 2021 calendar year (i.e., August 31, 2021). Activity data was gathered that was believed to most strongly correlate to a category of emissions within the NIR. A hierarchy in the preferred type of data that correlates to emissions was employed:
- Physical production data (i.e., physical units of production for the given sector). As an example, the total production of natural gas in Canada in m3 for the upstream natural gas production and processing sector.
- Economic data (i.e., gross domestic product for the given sector)
- Demographic data (i.e., population growth or other per capita demand statistics available)
In a few cases no suitable activity data for the year of concern was identified. To address this, historical relationships between emissions for the activity were developed instead to reveal the historical trends, similar to the method used for energy efficiency and decarbonization.
Once early estimates of national emissions are prepared a Kaya decomposition method can be employed to parse out the main drivers of emissions increases and decreases for any emission category in the NIR for any period of interest (Ang et al. 2003; Mai L et al. 2019). The decomposition method allows changes in greenhouse gases to be disaggregated using an equation that decomposes greenhouse gases into measurable indicators of activity or production, energy efficiency intensity (per unit of activity), and greenhouse gas intensity (emissions per unit of energy consumed). The method has been used by many policy makers to track progress in reducing greenhouse gas emissions.
We can express the Kaya identity as an equation that links CO2 emissions with energy, production, economy, and population:

Where:
- C=CO2e emissions
- E=energy consumption
- A= Unit of Activity (e.g., Physical Production or $GDP)
In additive form the three factor Kaya decomposition is as follows:
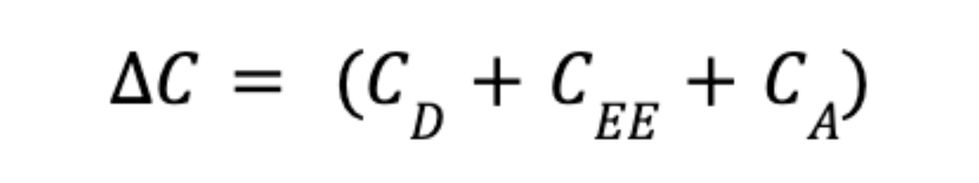
Where:
- ∆C= Change in emissions between last inventory year and more current year.
- CD = Change in the emissions due to decarbonization.
- CEE = Change in the emissions due to energy efficiency.
- CA = Change in the emissions due to activity effect (e.g., change in production volume or change in economic activity).
Data Collection
Table 1 provides the source and date of publication, release or access for the different activity, and energy data collected for the project.
Table 1: Activity and Energy Data Collected to Develop Preliminary Estimates
| Type of Data | Data Description | Data Source |
|---|---|---|
| Activity | Production of public electricity (GWh) | Statistics Canada. Table 25-10-0015-01 Electric power generation, monthly generation by type of electricity |
| Natural Gas Production (N m3) | Statistics Canada. Table 25-10-0055-01 Supply and disposition of natural gas, monthly (data in thousands) (x 1,000) | |
| Conventional Oil Production (barrels) | Statistics Canada. Table 25-10-0063-01 Supply and disposition of crude oil and equivalent | |
| Bitumen Production (barrels) | Statistics Canada. Table 25-10-0063-01 Supply and disposition of crude oil and equivalent | |
| Petroleum Refining (m3) | Statistics Canada. Table 25-10-0063-01 Supply and disposition of crude oil and equivalent | |
| Industry Gross Domestic Product (GDP) by NAICS code (2012$million) | Statistics Canada. Table 36-10-0434-01 Gross domestic product (GDP) at basic prices, by industry, monthly (x 1,000,000) | |
| Iron and Steel Production (kilotonnes) | WorldSteel Association Steel Statistical Yearbook 2022 Concise Version. | |
| Cement Production (kilotonnes) | CEEDC Database. | |
| kilometres travelled by major vehicle type(km millions) | ECCC Road Transportation Vehicle kilometres 2005-2021Personal Communication. ECCC Pollutant Inventories and Reporting. July 25, 2023.2022 forecast based on past growth and 2022 transport fuel consumption estimates. | |
| Animal Production Cattle, claves, hogs and sheep (head of animals produced weighted) | Statistics Canada. Table 32-10-0130-01, Table 32-10-0160-01, Table 32-10-0129-01 Number of Cattle, Hogs, Sheep. Weighted for Cattle Population. | |
| Coal Production (tonnes) | Statistics Canada. Table 25-10-0046-01 Coal, monthly production and exports (x 1,000) Total all coal types. | |
| Fertilizer Production (tonnes of production) | Statistics Canada. Table 32-10-0037-01 Canadian fertilizer production, by product type and fertilizer year, cumulative data (x 1,000). Sum by mass NH3 ammonia of (Ammonia, urea, urea ammonium nitrate, ammonium sulphate, ammonium nitrate) | |
| Lime and Gypsum Production (tonnes) | Statistics Canada. Table 16-10-0020-01 Production and shipments of non-metallic minerals, monthly Lime + 0.25 weighted gypsum | |
| Population of Canada | Statistics Canada. Table 17-10-0005-01 Population estimates on July 1st, by age and sex | |
| Energy | primary and secondary energy demand by major industry and economic sector (Terajoules) | Statistics Canada. Table 25-10-0029-01 Supply and demand of primary and secondary energy in terajoules, annual |
| Energy consumption by NAICS sector (Terajoules fossil and Terajoules renewable) | Canadian Energy and Emissions Data Centre (CEEDC) Energy and Emissions Database. |
References
Ang, B. W., Liu, F. L., and Chew, E. P. 2003. ”Perfect decomposition techniques in energy and environmental analysis.” Energy Policy, 31(14), 1561–1566. https://doi.org/10.1016/S0301-4215(02)00206-9
ECCC (Environment and Climate Change Canada). 2022. “National Inventory Report 1990-2020: Greenhouse Gas Sources and Sinks in Canada.“ Canada’s Submission to the United Nations Framework Convention on Climate Change. https://www.canada.ca/en/environment-climate-change/services/climate-change/greenhouse-gas-emissions/inventory.html
ECCC (Environment and Climate Change Canada). 2023. Canada’s Eighth National Communication on Climate Change and Fifth Biennial Report. January 2023. https://unfccc.int/documents/624782
Mai L, Ran Q, Wu H., (2019). “A LMDI decomposition analysis of carbon dioxide emissions from the electric power sector in Northwest China.” Natural Resource Modeling 33(4), e12284.